There are several
aspects such as: the height at a given heel angle, the slope of the
curve at any given angle and area under the curve from zero degrees
out to a given angle. The height of the curve tells how much force the
boat is creating to return upright. The slope of the curve indicates the
resistance to further tipping. The area under the curve corresponds to
how much energy is absorbed by the boat when it is tipped.
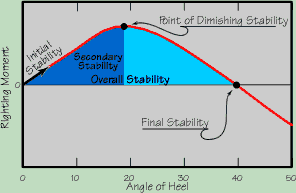 The stability curve (red) can be broken down into several identifiable
points. Obviously, the first is the height of the curve. Given any two
boats tipped to the same angle, the one with the higher curve at that
angle will apply more force to return upright, so it will feel stiffer
or more stable. The next thing to look at is the slope of the curve at
0 degrees. The curve that climbs more steeply will have a greater initial
stability and feel stiffer. The peak of the curve is where the stability
starts to diminish. Having this point either be higher or at a greater
angle of heel will make the boat feel like it has more secondary stability.
By looking at the area under the curve until the peak of the curve (the
dark blue area) you can get one value for the secondary stabilty. The combined
blue areas is an indication of how much tipping energy the boat can absorb
before a capsize is inevitable. The point of final stability where the
line crosses zero is the angle beyond which capsize is inevitable without
bracing.
Constant Waterline Width
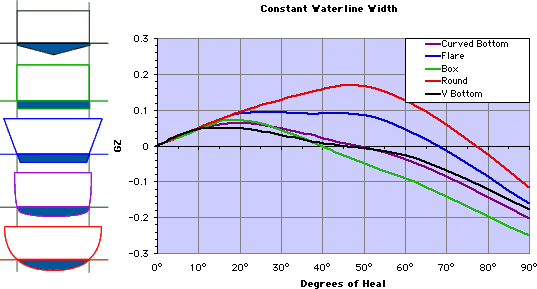
Above are 5 different boats
with their stability curves. Although the boats have varying widths, the
waterline width and shape is the same in all boats. The slope of the curve
near zero is nearly identical regardless of the different shapes above and
below the waterlines. This is because initial stability is not dependant
on the overall shape of the boat, only the waterline width and shape.
Although you would expect a round bottomed (red) boat to be
the least stable, in this case it has the highest overall stability
because it flares out a lot above the waterline. And even though the
"flared" (blue) shape has similar overall width, the volume distribution
of the rounded shape gives it more stability. Any shape that widens above
the waterline will tend to have more secondary stability.
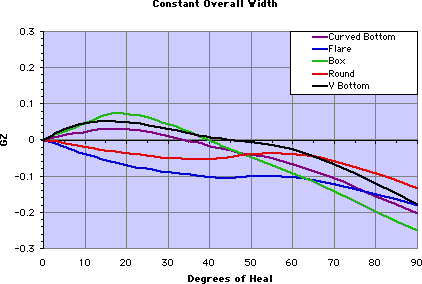
Constant Overall Width
Using the same basic hull shapes
below are the curves when overall widths are the same. Now, the round
bottom is much less stable because the waterline width is much less.
This demonstrates why knowing the overall width of a ship is not that
informative. One will learn more by asking for both the overall width
plus the width at the waterline.
As discussed earlier, Initial stability is the resistance of the boat to
tip just a little bit. The slope of the line at the beginning of the
stability curve indicates this resistance. In fact, the slope of the
line at any point along the stability curve indicates how much more force
will be required to make the kayak tip just a little bit more. Put another
way, the slope shows how much an additional tipping force will effect
the boat if it is already tipped. A shallower, flatter slope means that
an additional force will have more effect.
Secondary
stability is generally related to the maximum height of the
stability curve. Obviously, a higher maximum righting moment will be
more stable. But the angle at which the curve reaches the maximum is
also important because that indicates how far one can heel the boat
before you begin losing stability. One way of combining the height and
angle of maximum righting moment is to look at the size of the area between
the curve and the horizontal zero line. This indicates the work or energy
required in tipping the boat to that point. A larger area under the curve
indicates that it will take more effort to tip the boat.
Back to the top
©
Copyright Binoy Perumpalath,
If you wish to copy, change or alter in anyway please contact
Binoy Perumpalath at
binoy@binoydesign.com
Last modified on 07 April 2004.

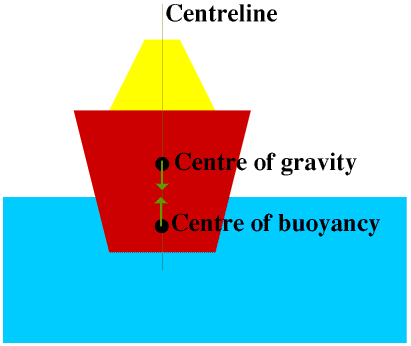 Consider the weight
of the ship to be a single force acting through a single point, its
centre of gravity (CG), and the buoyancy of
the water to be another single force acting through another single
point, the centre of buoyancy (CB). The centre
of buoyancy is the point which would have been the centre of gravity
of the water which the ship has displaced. For submarines, whether on
the surface or submerged, the centre of buoyancy is usually above the
centre of gravity, but for most surface ships the centre of gravity is
above the centre of buoyancy.The goal is to keep the
CG vertically in line with the CB. Unfortunately, the most stable position
is always going to be with the CG hanging below the CB like a rock hanging
from a string. To keep the ship from turning upside down, the CB now needs
to move under the ship before it rotates all the way over. As the ship rotates
in the direction of tipping, the hull pushes down into the water on that
side while the other side lifts out of the water. This action of adding
volume (buoyancy) on the side you are tipping and subtracting volume on
the other side will cause the center of buoyancy to move toward the side
you are tipping. If the boat is shaped to be stable, the CB will move out
to the side faster than the CG.
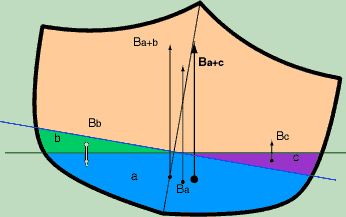 As a boat tips the buoyancy is moved. In the picture at
right, the blue line is the original "even-keel" waterline. As the
boat tips to the right the wedge shaped green volume (b) lifts out
of the water and the other wedge of purple (c) sinks into the water.
The original center of buoyancy (Ba+b) is moved to the point Ba by the
subtraction of volume (b) and then moved even more by the addition of volume
(c). It is this motion of the buoyancy which creates stability.The change in buoyancy happens due to
changes of volume near the waterline. This is why initial stability
is dependant on the waterline shape and width and not on the shape below
the waterline. Because it is only the water near the waterline that
is initially effected by tipping, it is only the shape near the waterline
that effects initial stability.
 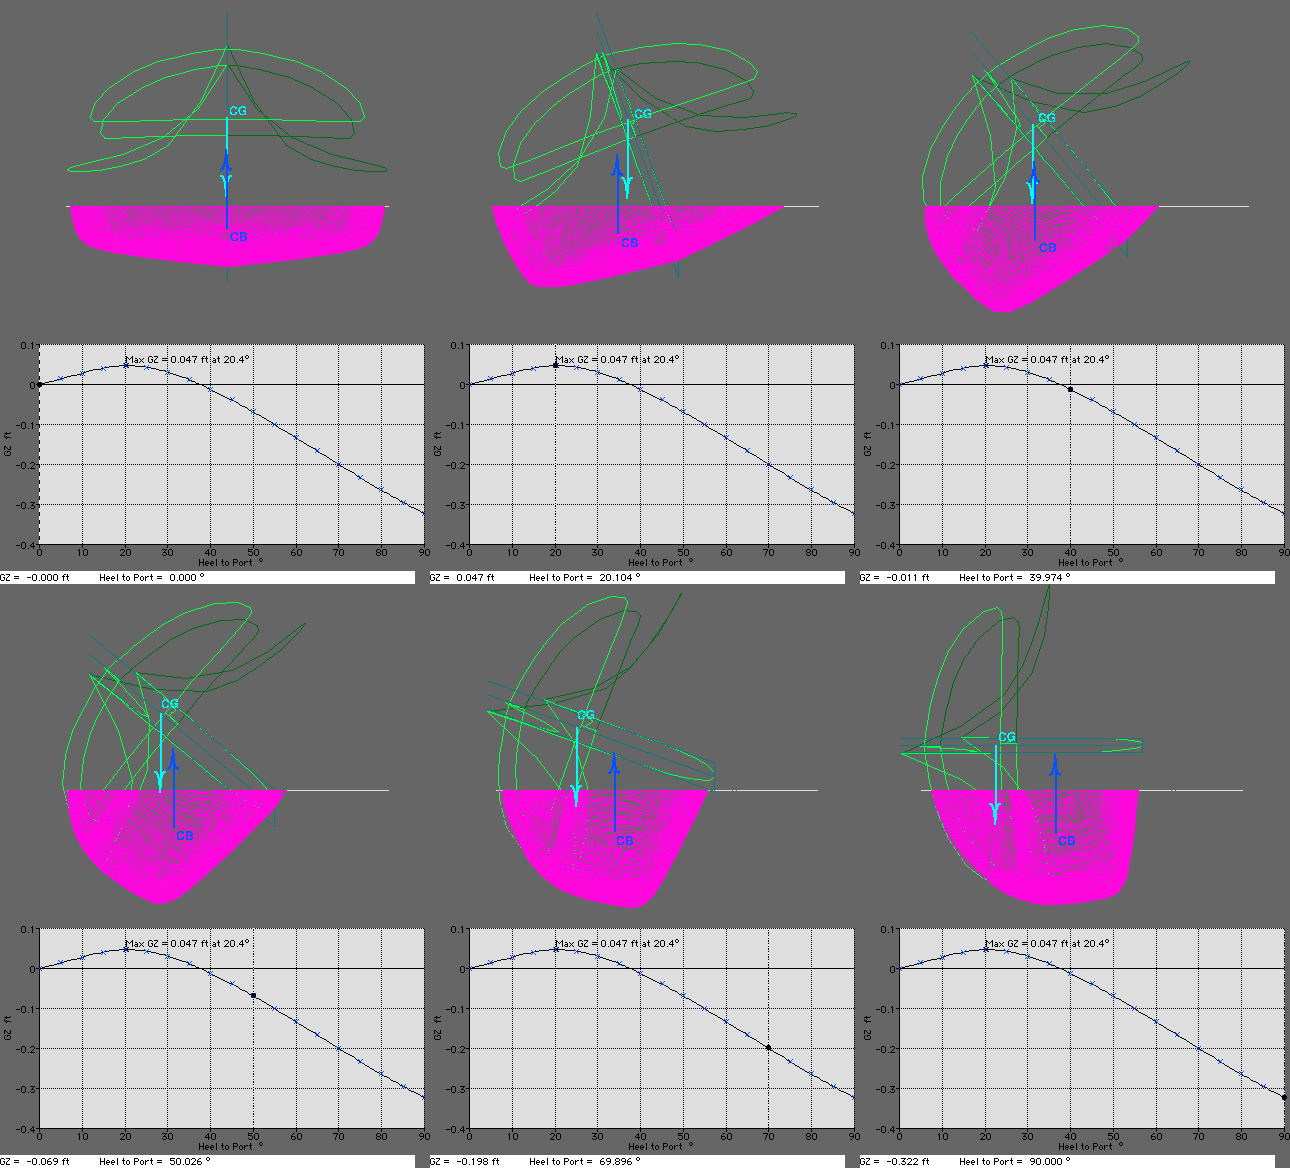 The stability curve is a graph of the horizontal distance
(GZ) between the Center of Buoyancy (CB) and the Center of Gravity
(CG). When you are tipping to port, as long as the CB is farther to
port than the CG, the graph will stay positive. The horizontal distance
(GZ)is proportional to the righting moment, or the amount of force the
boat will apply to returning upright.
 The stability curve (red) can be broken down into several identifiable
points. Obviously, the first is the height of the curve. Given any two
boats tipped to the same angle, the one with the higher curve at that
angle will apply more force to return upright, so it will feel stiffer
or more stable. The next thing to look at is the slope of the curve at
0 degrees. The curve that climbs more steeply will have a greater initial
stability and feel stiffer. The peak of the curve is where the stability
starts to diminish. Having this point either be higher or at a greater
angle of heel will make the boat feel like it has more secondary stability.
By looking at the area under the curve until the peak of the curve (the
dark blue area) you can get one value for the secondary stabilty. The combined
blue areas is an indication of how much tipping energy the boat can absorb
before a capsize is inevitable. The point of final stability where the
line crosses zero is the angle beyond which capsize is inevitable without
bracing.
